Categories:

Moderna Inc (MRNA) CEO Stephane Bancel Sold $1.4 million of Shares

Source

CEO of Moderna Inc (30-Year FinancialInsider TradesStephane Bancel (insider trades) sold 11,046 shares of MRNA on 03/05/2021 at an average price of $128.18 a share. The total sale was $1.4 million.

Moderna CEO Stock Buy and Sell History. IPO at $23 in 12/2018.

Moderna Inc has a market cap of $49.36 billion; its shares were traded at around $123.470000 with and P/S ratio of 61.56.

CEO Recent Trades:

  • CEO Stephane Bancel sold 11,046 shares of MRNA stock on 03/05/2021 at the average price of $128.18. The price of the stock has decreased by 3.67% since.
  • CEO Stephane Bancel sold 19,000 shares of MRNA stock on 03/04/2021 at the average price of $136.64. The price of the stock has decreased by 9.64% since.
  • CEO Stephane Bancel sold 11,046 shares of MRNA stock on 02/26/2021 at the average price of $154.7. The price of the stock has decreased by 20.19% since.
  • CEO Stephane Bancel sold 19,000 shares of MRNA stock on 02/25/2021 at the average price of $150.66. The price of the stock has decreased by 18.05% since.
  • CEO Stephane Bancel sold 11,046 shares of MRNA stock on 02/19/2021 at the average price of $174.8. The price of the stock has decreased by 29.36% since.

Directors and Officers Recent Trades:

  • General Counsel and Secretary Lori M. Henderson sold 6,600 shares of MRNA stock on 03/04/2021 at the average price of $128.58. The price of the stock has decreased by 3.97% since.
  • President Stephen Hoge sold 20,000 shares of MRNA stock on 03/03/2021 at the average price of $149.69. The price of the stock has decreased by 17.52% since.
  • See remarks Juan Andres sold 5,000 shares of MRNA stock on 03/03/2021 at the average price of $145.6. The price of the stock has decreased by 15.2% since.
  • General Counsel and Secretary Lori M. Henderson sold 6,600 shares of MRNA stock on 03/02/2021 at the average price of $153.77. The price of the stock has decreased by 19.7% since.
  • Director Noubar Afeyan sold 1,753,697 shares of MRNA stock on 02/24/2021 at the average price of $146.19. The price of the stock has decreased by 15.54% since.

For the complete insider trading history of MRNA, click here

This article first appeared on GuruFocus.

Posted in General.

Tagged with , , , , .


Roll Up Your Sleeve – The Jab!

Posted in General.

Tagged with , , .


KDHE quietly reduced cycle threshold on COVID tests

by Patrick Richardson

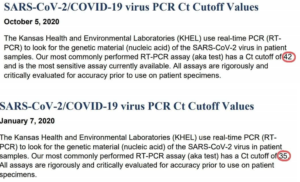
Earlier this month — and without fanfare — the Kansas Department of Health and Environment’s Health and Environmental Laboratories reduced the cycle threshold for its real-time COVID-19 test from 42 to 35 cycles.  (The screengrab below shows KDHE mistakenly dated the change January 2020, but the link address is dated 2021 and KDHE wasn’t running COVID tests a year ago.)

This comes after months of warnings by health professionals — including Dr. Anthony Fauci and the World Health Organization — that high cycle thresholds in the most commonly used tests were producing false positives.

The cycle threshold is — roughly — the number of times a bit of genetic matter must be copied by the testing equipment to determine how infectious a given individual is. The higher the cycle threshold needed to identify COVID, the less viral load a person has; some virologists say results above 35 cycles are “false positives” because they are only detecting dead nucleotides and are not contagious.

In October of 2020, KHEL said their most commonly-used test “has a Ct cutoff of 42 and is the most sensitive assay [test] currently available.”

On January 7, the Ct cutoff was changed to 35, and the last half of that sentence omitted.

The Sentinel reached out to KDHE spokeswoman Kristi Zears, to ask if private laboratories being used by local governments like Wyandotte County had also reduced their cycle threshold, but received no response.

Fauci has stated that the cycle threshold should be 34 or below.

“If you get a cycle threshold of 35 or more, the chances of it being replication-competent are minuscule,” Fauci said at roughly the four-minute mark of this video. ‘Replication competent’ means particles capable of infecting cells and replicating to produce additional infectious particles.

Meanwhile, rising case-counts have been continually used by Governor Laura Kelly to justify continued restrictions, largely ineffective mask mandates, and lockdowns.

The problem is, the WHO has now warned against over-sensitive tests, and recently issued guidance that “careful interpretation of weak positive results is needed (1). The cycle threshold (Ct) needed to detect virus is inversely proportional to the patient’s viral load. Where test results do not correspond with the clinical presentation, a new specimen should be taken and retested using the same or different NAT technology.”

Downward trend in Kansas

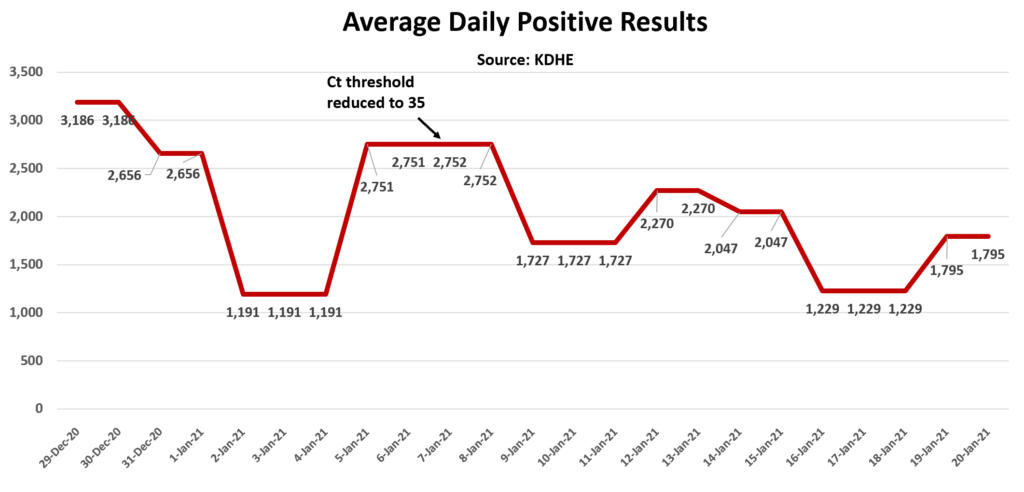
While there is no proof that the lowered Ct has led to a sudden reduction in “cases” — and thanks to KDHE’s silence it is unclear if private labs have followed suit — it is notable that, while case-counts have actually been dropping since Thanksgiving, there has been a noticeable drop in average daily positive results since Jan. 7, from 2,752 on the 7th to 1,795 between the 19th and 20th of January.

KDHE doesn’t publish daily case updates; the daily numbers in the chart above represent the daily average between reporting points.

Proper cycle threshold

As national outlet PJ Media points out, the so-called “case” numbers should more accurately be called positive tests, and as PJ’s Stacey Lennox writes, “The New York Times and several experts admitted in late August that up to 90% of positive PCR tests were not indicative of the active illness that could be transmitted to others.”

As the Sentinel previously reported, Dr. Michael Mina, an assistant professor of epidemiology at both Harvard Medical School and the Harvard T.H. Chan School of Public Health, told Harvard Magazine that reporting people positive on tests with a high cycle threshold are “false positives.”

“Tests with thresholds so high may detect not just live virus but also genetic fragments, leftovers from infection that pose no particular risk,” Mina said. “Akin to finding a hair in a room long after a person has left.”

One maker of the COVID PCR test, Bioningentech, offers guidance quite similar to those in a New York Times article, which points to oversensitive tests nationwide.  Cycle thresholds between 12 and 36 are considered positive; results between 36 and 40 cycles are considered marginally positive, and anything over 40 cycles is considered negative.

“Any test with a cycle threshold above 35 is too sensitive, agreed Juliet Morrison, a virologist at the University of California, Riverside. “I’m shocked that people would think that 40 could represent a positive,” she said.

“A more reasonable cutoff would be 30 to 35, she added.

Dr. Mina said he would set the figure at 30, or even less.

“Those changes would mean the amount of genetic material in a patient’s sample would have to be 100-fold to 1,000-fold that of the current standard for the test to return a positive result — at least, one worth acting on.”

Source

Posted in General.

Tagged with , , , , , , , .


SARS-CoV-2/COVID-19 virus PCR Ct Cutoff Values

SARS-CoV-2/COVID-19 virus PCR Ct Cutoff Values

January 7, 2021

The Kansas Health and Environmental Laboratories (KHEL) use real-time PCR (RT- PCR) to look for the genetic material (nucleic acid) of the SARS-CoV-2 virus in patient samples. Our most commonly performed RT-PCR assay (aka test) has a Ct cutoff of 35. All assays are rigorously and critically evaluated for accuracy prior to use on patient specimens.

  • Ct stands for ‘cycle threshold.’ The higher the Ct number, the lower the amount of virus detected in the specimen.
  • Not all RT-PCR tests use the same Ct cutoff. Each test is different, with different sensitivities based on things like how the test was designed.
  • Any specimen that has a Ct below the cutoff for the test is most likely a true positive. Ct cutoffs are established by test manufacturers through evaluation of known positive and negative samples and are approved as a part of the FDA’s Emergency Use Authorization process. Clinical laboratories, including KHEL, are federally regulated and always perform rigorous in-house evaluation and validation of each new assay before using it to test patient samples. This involves testing known positive and negative samples to ensure the assay is working properly and not producing false results.
  • SARS-CoV-2 diagnostic RT-PCR assays are qualitative (yes or no) tests. They are not designed to determine the amount of virus present in the specimen (viral load) because many external factors can influence these results. Ct values can differ immensely between a poorly collected specimen to a well-collected specimen. A common reason for false negatives is poor specimen collection. Other factors that can impact Ct values include proper (or improper) specimen transport, specimen storage temperatures, how many times the specimen has been frozen, and the instrument on which testing is performed.
  • Viral loads can vary by body site and the stage of infection. Early during infection virus is easiest to detect in the upper respiratory tract with a swab. Later during infection as the virus migrates, the virus may be harder to detect in the upper respiratory tract but testing of lower respiratory tract samples may be more likely to detect the virus.
  • The amount of virus present in a person can vary during the course of their illness. A specimen may have a higher Ct value (low viral load) if the patient is early in their infection and the virus is still increasing in their body or later in infection when the viral load is decreasing. In both of these examples the high Ct still represents a true positive with SARS-CoV-2 nucleic acid detected.
  • For SARS-CoV-2, it is still unknown how much virus is needed to transmit virus from person to person and cause new infections. This is one of the many areas of ongoing research.
  • RT-PCR tests are the “gold standard” for SARS-CoV-2 testing worldwide, not just in the U.S, with the highest sensitivity and specificity of any known diagnostic test for this disease.

Source: Kansas Department of Health and Environment

Posted in General.

Tagged with , , , , , , , .


On the Back of a Tiger: Episode One, Gilbert Ling

Posted in General.

Tagged with , .


Dr. Ray Peat – Full Interview from On the Back of a Tiger

Posted in General.

Tagged with , , , , , .


Causation and Prevention of Non-Contact Achilles Tendon Tears

Mechanics that cause non-contact achilles tendon tears while stepping backwards include the following:

  • external hip rotation
  • heel moves towards midline with toes outward
  • inside edge foot pressure
  • flat foot (arch collapse)
  • knees face opposite directions
  • close to terminal knee extension is common
Five NBA achilles tendon tears (pictures 3 and 4 are same player)

The opposite mechanics are protective for non-contact achilles tendon tears. Mechanics that prevent non-contact achilles tendon tears while stepping backwards include the following:

  • internal hip rotation
  • heel moves away from midline with toes inward
  • outside edge foot pressure
  • no arch collapse
  • both knees face same direction
  • heel off the ground with knee facing inward
  • knee flexion
  • pivot on the outside edge of the right foot at the 4th and 5th metatarsals


In the video above, Michael Jordan masterfully steps backwards with his right leg. Stepping backwards safely requires internal rotation of the hip and outside edge foot pressure. Many training facilities repeatedly wire athletes to external rotate the hip while applying inside edge foot pressure (for instance, during the back squat, front squat, or clean). Mechanics learned in the gym setting can contribute to non-contact injuries.

Posted in General.

Tagged with , , , , , .


T3 Therapy to Reset Low Body Temperature in Hypothyroidism

Also see:
Wilson’s Temperature Syndrome
Basis Guidelines Wilson T3 Protocol
Wilson’s Temperature Tracking Chart
Wilson’s low Temperature Syndrome
Wilson Treatment Guidelines
Ray Peat, PhD on Thyroid, Temperature, Pulse, and TSH
Dosing with T3-only (or with low-dose NDT, or the combination of T4/T3)

https://www.youtube.com/watch?v=ztjDtZ87cX0
https://www.youtube.com/watch?v=NH2JU98iBoM

https://www.youtube.com/watch?v=G0QWZbI5Vvs


https://www.youtube.com/watch?v=5dyRatdx43M

Posted in General.

Tagged with , , , , , , , , , , , , , , , , , , , , , , , , , , , , , , , , , , , , , , .


Bodily Resources vs Demands

Also see:
Stress — A Shifting of Resources
Collection of FPS Charts
Sugar (Sucrose) Restrains the Stress Response
Low Blood Sugar Basics
Ray Peat, PhD on Low Blood Sugar & Stress Reaction
Bowel Toxins Accelerate Aging
Exercise Induced Stress
Carbohydrate Lowers Exercise Induced Stress
Low Carb Diet – Death to Metabolism
Can Endurance Sports Really Cause Harm? The Lipopolysaccharides of Endotoxemia and Their Effect on the Heart
Running on Empty
Exercise and Endotoxemia
Ray Peat, PhD on Endotoxin
Endotoxin: Poisoning from the Inside Out
Ray Peat, PhD: Quotes Relating to Exercise

“Life is a condition alternating between excitation, destruction and unbalance, and reorganization, equilibrium and rest.” -Kurt Goldstein

The bucket pictogram below, inspired by the ideas of James Clear, explains many health concepts. The body resources bucket contains some of the primary factors that ensure good health. These resources are drained by the body’s demands (dotted arrow), which vary from person to person.

Bodily Resources vs Demands

Bodily Resources vs Demands

The global objective is to maximize bodily resources and minimize demands to avoid momentary or permanent changes in bodily function. Tilt the scales in your favor.

Screen Shot 2016-08-01 at 7.56.30 PM

The body’s resources are finite, and the rate at which they are depleted is determined by your body’s demands. Maintain body balance by ensuring that your resources always trump your body’s demands by continually depositing resources on a daily basis and reducing demands where possible.

Young people are free of disease because their bodily resources are so vast that demands are easily met. When young people are compromised, they recover easily because they can quickly tilt the scales back in their favor.

There are direct parallels between finance and these two buckets. The resources bucket is analogous to a savings account, and the demands bucket represents total expenses. Don’t spend more money than you have to avoid financial turmoil or bankruptcy. Make deposits into your resources bucket on a daily basis and reduce expenses/demands to ensure protection from resource bankruptcy and a compromised body.

Here are some additional bullet points:

• The contents of each bucket will vary for each person. Some of the most basic elements are listed that apply to most people.
• Weight management and health concerns at their base come about due to imbalance between resources and demands. Each person has his/her own adaptation to the imbalance. Consider how robust your resources are at present and have been over your lifespan. Your present state is a reflection of all your years put together.
• Simple example of this pictogram at work is when one gets a cold or sickness. Someone gets a cold because demands were excessive relative to their (immune) resources. When someone gets a cold, he/she doesn’t go exercise vigorously (which is another demand) because energy levels and appetite are low. Rather, he/she builds lowers demands by taking time off from work/school if possible and sleeping/resting more and eventually eating well to build up his/her resources again to achieve recovery. If a person cannot aggregate the resources necessary to overcome the illness, the illness remains. How often you get sick and how long it takes you to recover when you do get sick is one indicator of how robust your resources bucket is.
• Restorative sleep and midday naps are an outstanding way to lower demands on your system.
• A person with sleep difficulties (sleep apnea, mouth breathing while sleeping, insomnia, waking several times during the night, waking feeling unrested, nocturnal urination, teeth grinding) is often the individual with high demands but low available resources. This creates a vicious cycle because of the inability to lower demands significantly via restorative sleep.

Additional Resources:
“The Stress of Life” by Hans Selye (book)
“Stress Without Distress” by Hans Selye (book)
“Why Zebras Don’t Get Ulcers” by Robert Sapolsky (book)
“Theory of Cumulative Stress – How to Recover When Stress Builds Up” by James Clear (online)

Posted in General.

Tagged with , , , , , , , , , , , , , , .


Calcium to Phosphorus Ratio of Vegetables and Fruits

Also see:
Calcium to Phosphorus Ratio, PTH, and Bone Health
Calcium to Phosphorus Ratio of Milk, Cheeses, Ice Cream by DrJ on RayPeatForum
Calcium Paradox
Source of Dietary Calcium: Chicken Egg Shell Powder
Low CO2 in Hypothyroidism
Blood Pressure Management with Calcium & Dairy
Hypertension and Calcium Deficiency
Excess Dietary Phosphorus Lowers Vitamin D Levels
Fatty Acid Synthase (FAS), Vitamin D, and Cancer
Phosphate, activation, and aging
Parmigiano Reggiano cheese and bone health
Preparing Powdered Eggshells for Calcium
Dairy, Calcium, and Weight Management in Adults and Children

Quotes by Ray Peat, PhD:
“The ratio of calcium to phosphate is very important; that’s why milk and cheese are so valuable for weight loss, or for preventing weight gain. For people who aren’t very active, low fat milk and cheese are better, because the extra fat calories aren’t needed.”

“The foods highest in phosphate, relative to calcium, are cereals, legumes, meats, and fish. Many prepared foods contain added phosphate. Foods with a higher, safe ratio of calcium to phosphate are leaves, such as kale, turnip greens, and beet greens, and many fruits, milk, and cheese.”

“Recent publication are showing that excess phosphate can increase inflammation, tissue atrophy, calcification of blood vessels, cancer, dementia, and, in general, the processes of aging.”

======================================================

This is a useful chart of fruits and vegetables ordered from highest to lowest calcium to phosphorus ratio (Ca:P). A ratio of 1.3:1 or higher is best to help keep parathyroid hormone down and protect cells from energy slowdowns and soft tissues from hardening/calcifying. The fruits and vegetables with a good ratio complement the consumption of milk and cheese.

Chart Source

GUINEA LYNX’ Sortable Veg & Fruit Chart
Pre-sorted to Ca:P
10 Calorie Quantities
Grams Sugar gm Calcium mg Ca:P Phos mg Magn mg Pot mg Sodium mg Vit_A RAE Vit_C mg
COLLARDS 33 0.15 48.33 14.5:1 3.33 3.00 56.33 6.67 111.00 11.77
BUTTERBUR,(FUKI) 71 UNKN 73.57 8.6:1 8.57 10.00 467.86 5.00 2.14 22.50
MUSTARD SPINACH,(TENDERGREEN) 45 UNKN 95.46 7.5:1 12.73 5.00 204.09 9.55 225.00 59.09
PAPAYAS 26 1.51 6.15 4.8:1 1.28 2.60 65.90 0.77 14.10 15.85
TURNIP GREENS 31 0.25 59.38 4.5:1 13.13 9.70 92.50 12.50 180.94 18.75
LAMBSQUARTERS 23 UNKN 71.86 4.3:1 16.74 7.90 105.12 10.00 134.88 18.61
DILL WEED,FRSH 23 UNKN 48.37 3.2:1 15.35 12.80 171.63 14.19 89.77 19.77
BASIL,FRESH 43 0.13 76.96 3.2:1 24.35 27.80 128.26 1.74 114.78 7.83
ARUGULA 40 0.82 64.00 3.1:1 20.80 18.80 147.60 10.80 47.60 6.00
ORANGES,ALL COMM VAR 21 1.99 8.51 2.9:1 2.98 2.10 38.51 UNKN 2.34 11.32
BEET GREENS 45 0.23 53.18 2.9:1 18.64 31.80 346.36 102.73 143.64 13.64
CABBAGE,CHINESE (PAK-CHOI) 77 0.91 80.77 2.8:1 28.46 14.60 193.85 50.00 171.54 34.62
DANDELION GREENS 22 0.16 41.56 2.8:1 14.67 8.00 88.22 16.89 112.89 7.78
CABBAGE,CHINESE (PE-TSAI) 63 0.88 48.13 2.7:1 18.13 8.10 148.75 5.63 10.00 16.88
KALE 20 UNKN 27.00 2.4:1 11.20 6.80 89.40 8.60 153.80 24.00
MUSTARD GREENS 38 0.62 39.62 2.4:1 16.54 12.30 136.15 9.62 201.92 26.92
PARSLEY 28 0.24 38.33 2.4:1 16.11 13.90 153.89 15.56 116.94 36.94
MELONS,CASABA 36 2.03 3.93 2.2:1 1.79 3.90 65.00 3.21 UNKN 7.79
NEW ZEALAND SPINACH 71 UNKN 41.43 2.1:1 20.00 27.90 92.86 92.86 157.14 21.43
WATERCRESS 91 0.18 109.09 2.0:1 54.55 19.10 300.00 37.27 145.46 39.09
SPINACH 43 0.18 43.04 2.0:1 21.30 34.40 242.61 34.35 203.91 12.22
SQUASH,WNTR,SPAGHETTI 32 UNKN 7.42 1.9:1 3.87 3.90 34.84 5.48 0.97 0.68
ENDIVE 59 0.15 30.59 1.9:1 16.47 8.80 184.71 12.94 63.53 3.82
TANGERINES,(MANDARIN ORANGES) 19 1.76 6.98 1.8:1 3.77 2.30 31.32 0.38 6.42 5.04
CELERY 63 1.14 25.00 1.7:1 15.00 6.90 162.50 50.00 13.75 1.94
PINEAPPLE,ALL VAR 20 1.97 2.60 1.6:1 1.60 2.40 21.80 0.20 0.60 9.56
PURSLANE 63 UNKN 40.63 1.5:1 27.50 42.50 308.75 28.13 41.25 13.13
ANISE SEED 3 UNKN 19.17 1.5:1 13.06 5.10 42.76 0.48 0.48 0.62
CABBAGE 40 1.28 16.00 1.5:1 10.40 4.80 68.00 7.20 2.00 14.64
CABBAGE,RED 32 1.24 14.52 1.5:1 9.68 5.20 78.39 8.71 18.07 18.39
SQUASH,WNTR,BUTTERNUT 22 0.49 10.67 1.5:1 7.33 7.60 78.22 0.89 118.22 4.67
BROCCOLI RAAB 45 0.17 49.09 1.5:1 33.18 10.00 89.09 15.00 59.55 9.18
CORIANDER (CILANTRO) LEAVES 43 0.38 29.13 1.4:1 20.87 11.30 226.52 20.00 146.52 11.74
RADISHES 63 1.16 15.63 1.3:1 12.50 6.30 145.63 24.38 UNKN 9.25
BLACKBERRIES 23 1.14 6.74 1.3:1 5.12 4.70 37.67 0.23 2.56 4.88
SQUASH,WNTR,ALL VAR 29 0.65 8.24 1.2:1 6.77 4.10 102.94 1.18 20.00 3.62
LETTUCE,GRN LEAF 67 0.52 24.00 1.2:1 19.33 8.70 129.33 18.67 246.67 12.00
LETTUCE,RED LEAF 63 0.30 20.63 1.2:1 17.50 7.50 116.88 15.63 234.38 2.31
CHERRIES,SOUR,RED 20 1.70 3.20 1.1:1 3.00 1.80 34.60 0.60 12.80 2.00
CRESS,GARDEN 31 1.38 25.31 1.1:1 23.75 11.90 189.38 4.38 108.13 21.56
TURNIPS 36 1.36 10.71 1.1:1 9.64 3.90 68.21 23.93 UNKN 7.50
CARROTS,BABY 29 1.36 9.14 1.1:1 8.00 2.90 67.71 22.29 197.14 0.74
LETTUCE,BUTTERHEAD (INCL BOSTON&BIBB TYPES) 77 0.72 26.92 1.1:1 25.39 10.00 183.08 3.85 127.69 2.85
LETTUCE,COS OR ROMAINE 59 0.70 19.41 1.1:1 17.65 8.20 145.29 4.71 256.47 14.12
CHARD,SWISS 53 0.58 26.84 1.1:1 24.21 42.60 199.47 112.11 161.05 15.79
KIWIFRUIT,GRN 16 1.47 5.57 1.0:1 5.57 2.80 51.15 0.49 0.66 15.20
BEANS,SNAP,GREEN 32 1.05 11.94 1.0:1 12.26 8.10 68.07 1.94 11.29 3.94
SQUASH,WINTER,ACORN 25 UNKN 8.25 0.9:1 9.00 8.00 86.75 0.75 4.50 2.75
MANGOS 15 2.28 1.54 0.9:1 1.69 1.40 24.00 0.31 5.85 4.26
LETTUCE,ICEBERG (INCL CRISPHEAD TYPES) 71 1.41 12.86 0.9:1 14.29 5.00 100.71 7.14 17.86 2.00
CARROTS 24 1.16 8.05 0.9:1 8.54 2.90 78.05 16.83 203.66 1.44
RASPBERRIES 19 0.85 4.81 0.9:1 5.58 4.20 29.04 0.19 0.39 5.04
SALSIFY,(VEG OYSTER) 12 UNKN 7.32 0.8:1 9.15 2.80 46.34 2.44 UNKN 0.98
PEARS 17 1.69 1.55 0.8:1 1.90 1.20 20.52 0.17 0.17 0.72
RUTABAGAS 28 1.56 13.06 0.8:1 16.11 6.40 93.61 5.56 UNKN 6.94
PEAS,EDIBLE-PODDED 24 0.95 10.24 0.8:1 12.62 5.70 47.62 0.95 12.86 14.29
CABBAGE,SAVOY 37 0.84 12.96 0.8:1 15.56 10.40 85.19 10.37 18.52 11.48
SQUASH,WINTER,HUBBARD 25 UNKN 3.50 0.7:1 5.25 4.80 80.00 1.75 17.00 2.75
SQUASH,SMMR,CROOKNECK&STRAIGHTNECK 53 1.86 11.05 0.7:1 16.84 10.50 116.84 1.05 4.21 10.16
STRAWBERRIES 31 1.53 5.00 0.7:1 7.50 4.10 47.81 0.31 0.31 18.38
CUCUMBER,WITH PEEL 67 1.11 10.67 0.7:1 16.00 8.70 98.00 1.33 3.33 1.87
BROCCOLI 29 0.50 13.82 0.7:1 19.41 6.20 92.94 9.71 9.12 26.24
MELONS,CANTALOUPE 29 2.31 2.65 0.6:1 4.41 3.50 78.53 4.71 49.71 10.79
WATERMELON 33 2.07 2.33 0.6:1 3.67 3.30 37.33 0.33 9.33 2.70
CHERRIES,SWEET 16 2.04 2.06 0.6:1 3.33 1.80 35.24 UNKN 0.48 1.11
CRANBERRIES 22 0.88 1.74 0.6:1 2.83 1.30 18.48 0.44 0.65 2.89
BRUSSELS SPROUTS 23 0.51 9.77 0.6:1 16.05 5.40 90.47 5.81 8.84 19.77
SWEET POTATO,UNPREP 12 0.49 3.49 0.6:1 5.47 2.90 39.19 6.40 82.44 0.28
RADISH SEEDS,SPROUTED 23 UNKN 11.86 0.5:1 26.28 10.20 20.00 1.40 4.65 6.72
SQUASH,SUMMER,SCALLOP 56 UNKN 10.56 0.5:1 20.00 12.80 101.11 0.56 3.33 10.00
PEPPERS,SWEET,YELLOW 37 UNKN 4.07 0.5:1 8.89 4.40 78.52 0.74 3.70 67.96
MELONS,HONEYDEW 28 2.26 1.67 0.5:1 3.06 2.80 63.33 5.00 0.83 5.00
GRAPES,RED OR GRN (EURO TYPE,SUCH AS THOMPSON SEEDLESS) 14 2.24 1.45 0.5:1 2.90 1.00 27.68 0.29 0.44 1.57
APPLES,WITH SKIN 19 2.00 1.15 0.5:1 2.12 1.00 20.58 0.19 0.58 0.89
RAISINS,SEEDLESS 3 1.98 1.67 0.5:1 3.38 1.10 25.05 0.37 UNKN 0.08
RAISINS,GOLDEN SEEDLESS 3 1.96 1.76 0.5:1 3.81 1.20 24.70 0.40 UNKN 0.11
BLUEBERRIES 18 1.75 1.05 0.5:1 2.11 1.10 13.51 0.18 0.53 1.70
PEPPERS,SWT,GRN 50 1.20 5.00 0.5:1 10.00 5.00 87.50 1.50 9.00 40.20
KOHLRABI 37 0.96 8.89 0.5:1 17.04 7.00 129.63 7.41 0.74 22.96
ASPARAGUS 50 0.94 12.00 0.5:1 26.00 7.00 101.00 1.00 19.00 2.80
CAULIFLOWER 40 0.76 8.80 0.5:1 17.60 6.00 119.60 12.00 UNKN 19.28
PARSNIPS 13 0.64 4.80 0.5:1 9.47 3.90 50.00 1.33 UNKN 2.27
PUMPKIN 38 0.52 8.08 0.5:1 16.92 4.60 130.77 0.39 141.92 3.46
RADICCHIO 43 0.26 8.26 0.5:1 17.39 5.70 131.30 9.57 0.44 3.48
ALFALFA SEEDS,SPROUTED 43 0.08 13.91 0.5:1 30.44 11.70 34.35 2.61 3.48 3.57
SWEET POTATO LEAVES 29 UNKN 10.57 0.4:1 26.86 17.40 148.00 2.57 14.57 3.14
PLUMS 22 2.16 1.30 0.4:1 3.48 1.50 34.13 UNKN 3.70 2.07
PEARS,ASIAN 24 1.68 0.95 0.4:1 2.62 1.90 28.81 UNKN UNKN 0.91
BEETS 23 1.57 3.72 0.4:1 9.30 5.40 75.58 18.14 0.47 1.14
SQUASH,SMMR,ZUCCHINI,INCL SKN 59 1.47 9.41 0.4:1 22.35 10.60 153.53 4.71 5.88 10.53
TOMATOES,RED,RIPE,YEAR RND AVERAGE 56 1.46 5.56 0.4:1 13.33 6.10 131.67 2.78 23.33 7.06
SQUASH,SMMR,ALL VAR 63 1.38 9.38 0.4:1 23.75 10.60 163.75 1.25 6.25 10.63
BEANS,FAVA,IN POD 11 UNKN 4.21 0.3:1 14.66 3.80 37.73 2.84 1.93 0.42
PEACHES 26 2.15 1.54 0.3:1 5.13 2.30 48.72 UNKN 4.10 1.69
PEPPERS,SWT,RED 32 1.36 2.26 0.3:1 8.39 3.90 68.07 1.29 50.65 41.19
YAM 8 0.04 1.44 0.3:1 4.66 1.80 69.15 0.76 0.59 1.45
SQUASH,ZUCCHINI,BABY 48 UNKN 10.00 0.2:1 44.29 15.70 218.57 1.43 11.91 16.24
PEAS,MATURE SEEDS,SPROUTED 8 UNKN 2.90 0.2:1 13.31 4.50 30.73 1.61 UNKN 0.84
NECTARINES 23 1.79 1.36 0.2:1 5.91 2.10 45.68 UNKN 3.86 1.23
BANANAS 11 1.37 0.56 0.2:1 2.47 3.00 40.23 0.11 0.34 0.98
PEAS,GREEN 12 0.70 3.09 0.2:1 13.33 4.10 30.12 0.62 4.69 4.94
LENTILS,SPROUTED 9 UNKN 2.36 0.1:1 16.32 3.50 30.38 1.04 0.19 1.56
OATS 3 UNKN 1.39 0.1:1 13.45 4.60 11.03 0.05 UNKN UNKN
WHEAT GERM,CRUDE 3 UNKN 1.08 0.0:1 23.39 6.60 24.78 0.33 UNKN UNKN
CORN,SWT,YEL 12 0.73 0.23 0.0:1 10.35 4.30 31.40 1.74 1.05 0.79
CEREALS RTE,WHEAT GERM,TSTD,PLN 3 0.20 1.18 0.0:1 30.00 8.40 24.79 0.11 0.13 0.16

Posted in General.

Tagged with , , , , , , , , , , , .